Personal Development, Business, Finance, and Investing for Everyone
An investment in knowledge always pays the best interest.
|
The act of saving and investing money regularly will significantly change the way you live your life in the future Risk comes from not knowing An investor's worst enemy is not the stock market but his own emotions. The key to making money in stocks is not to get scared out of them. Outline
What Is Technical Analysis? The Need For Timing Markets come with volatility!
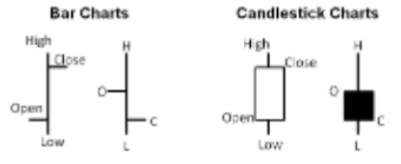
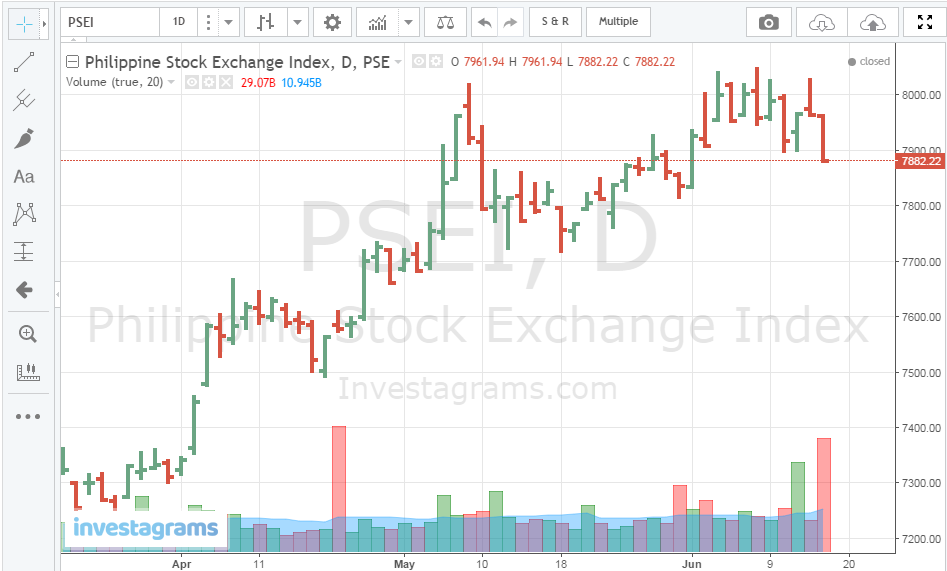
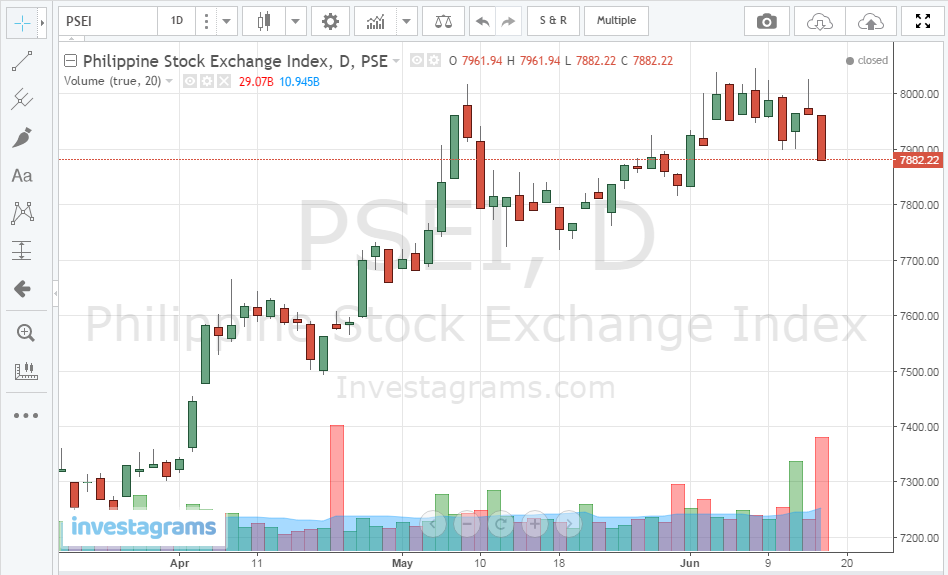
Technical Analysis is the study of price movement of any type of security pictured into a graph or chart for the purpose of spotting and following price trends. The Study Of Price Price discounts everything The market price tells you everything you need to know about a stock's expectations. Prices move in trends An object in motion tends to stay in motion while an object at rest tends to stay at rest. History repeats itself People will tend to react in similar fashion to certain kinds of stimuli grooming repettitive patterns of price activity. Looking At Prices Thru Graphs Open - the first price a stocks trades at High - the highest price it reaches in a trading day Low - the lowest price is tags during a trading day Close - the final trading price of the day Advantages of looking at graphs/charts
Studying Volume With Graphs Volume - measures the number of shares or value of those shares that trade in a day.
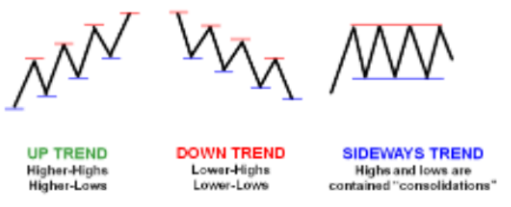
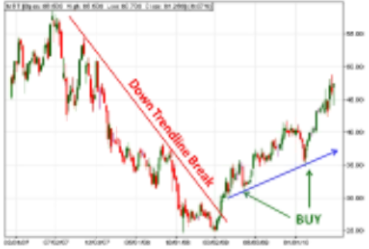
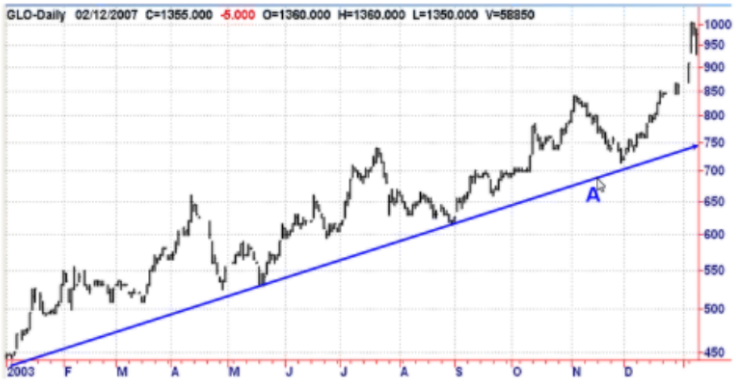
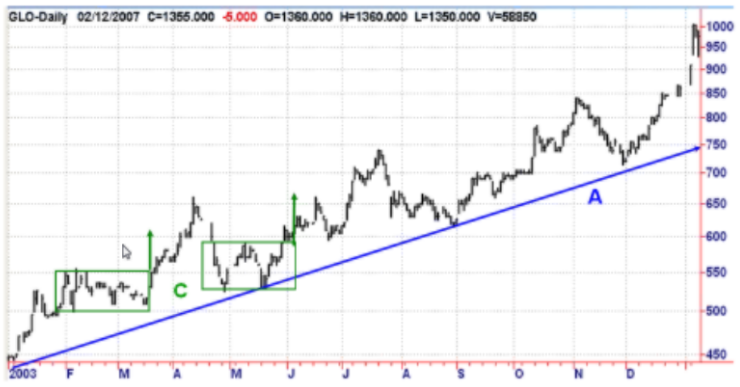
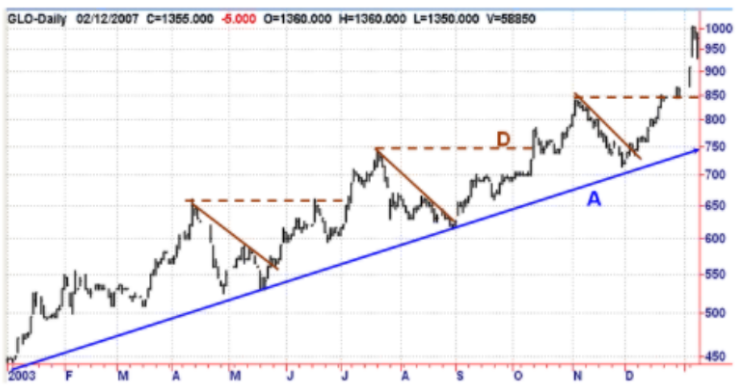
Spotting And Following Trends Support And Resistance Support is a price point underneath a market that shows heaviness in buying sufficient enough to prevent prices from falling down. Resistance is a price point above a market that shows heaviness in selling sufficient enough to prevent prices from rising up. Trade Idea: Buy near support and Sell close to resistance. Identifying Trends Trends are durable swings in market condition; they show the general direction of a securities' price over time. Trendlines Trendlines are guidelines that follow a trend that connect several areas of support or resistance to project buying or selling action over time. Up Trendlines are drawn by connecting major lows or support areas. Down Trendlines are drawn by connecting major highs or resistance areas. Sideways Trends are drawn by connecting resistance points and by connecting support points. Trendline Periods State your time period:
(Decide your term then loo at data within that time frame.) Trendlines In Action Strategy:
Strategy:
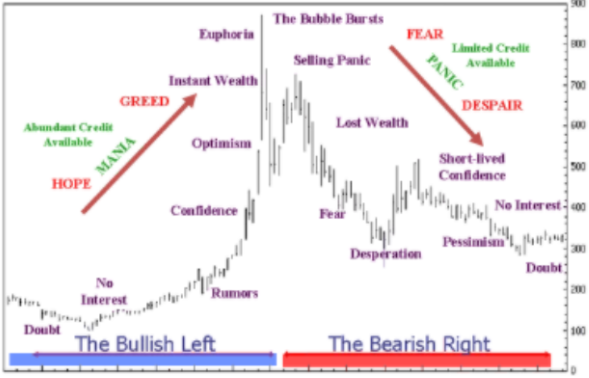
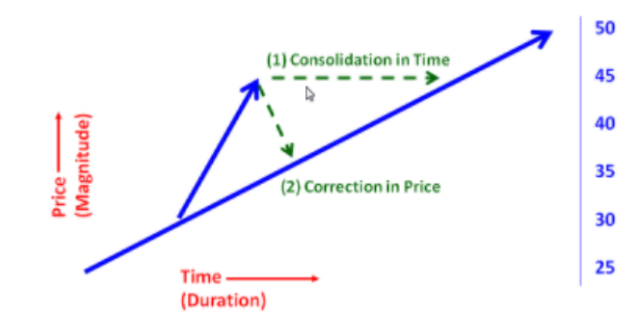
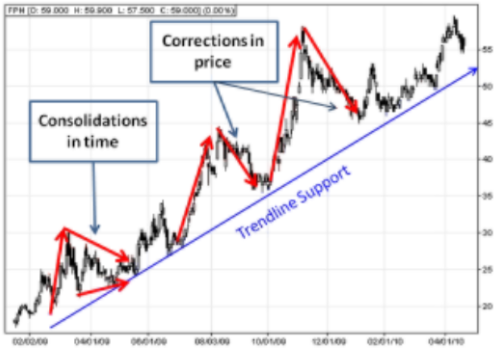
Understanding Corrections And Area Patterns Bull and Bear Cycle Market's Self-Correcting Action Remember that "it takes time to move a price a certain distance" ...any exaggeration must be paid for by an adjustment in time or price. Demonstrating Corrections Extended prices will be 'fixed' by market forces.
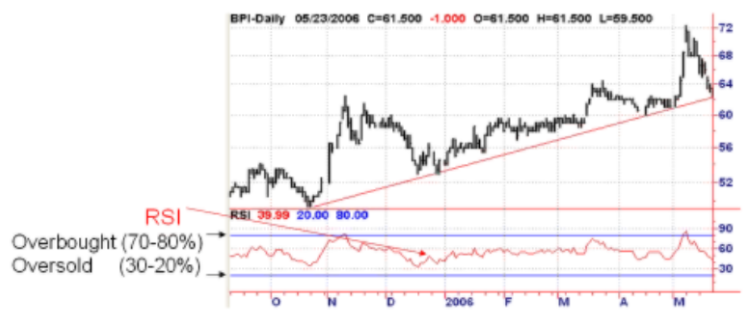
Overbought
Oversold
Area Patterns
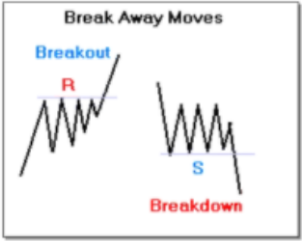
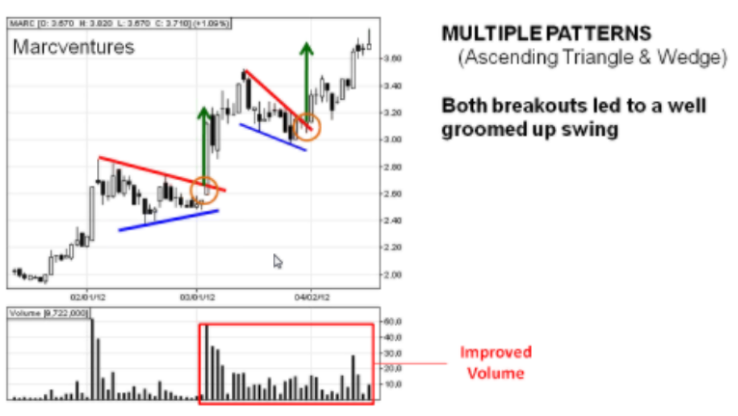
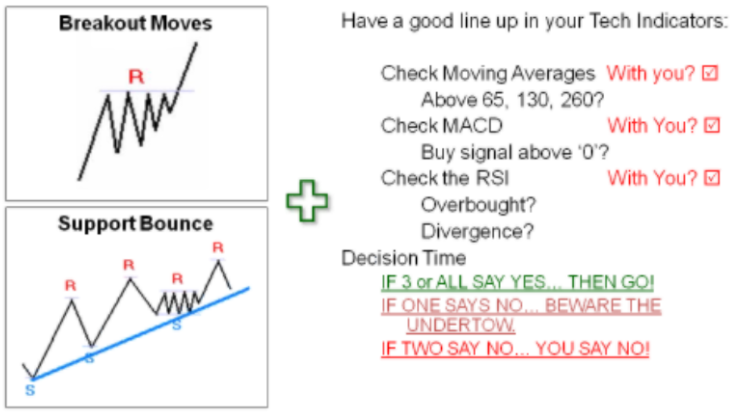
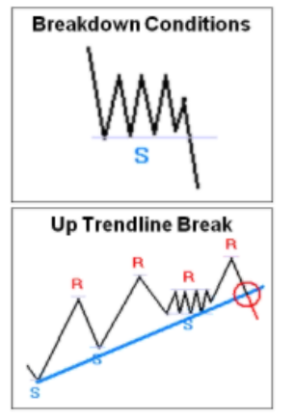
Push out of a consolidation/pattern: Breakout a condition where prices push themselves above a pattern's resistance commanding a "Buy" Breakdown a condition where prices push themselves below a pattern's support commanding a "Sell" Shape can unravel clues to its directional bias. Studying the various shapes of consolidations can aid in exposing who is wining the battle between buyers and sellers. Size can tell us the eventual target to which a price could go after a breakout (or breakdown) scenario.
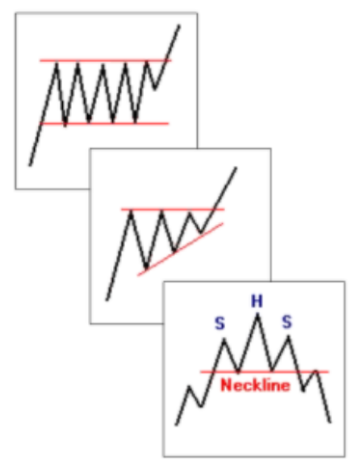
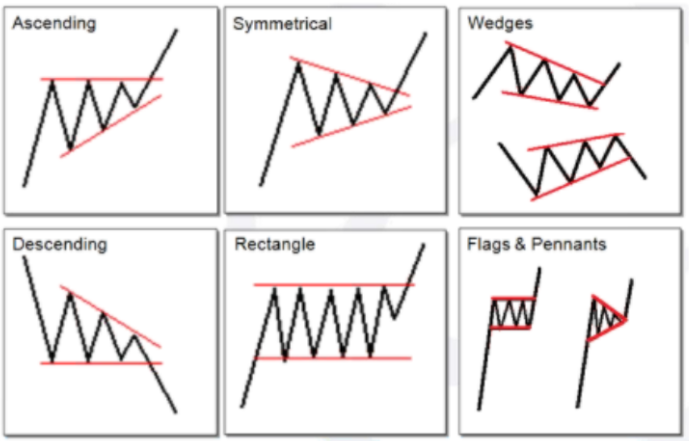
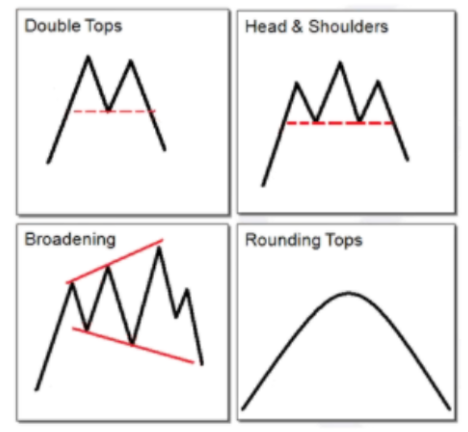
Types Of Area Patterns Continuation Patterns Reversal Patterns Using Patterns And Volume In Graphs Systems Trading: Technical Indicators A Technical Indicator is a study of price data derived from various statistical formula plotted onto a graph. It serves three basic functions: To Alert To Confirm } Consequential Price Movements To Predict Three most popular indicators:
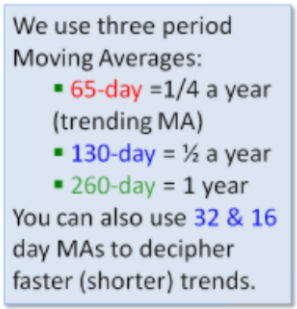
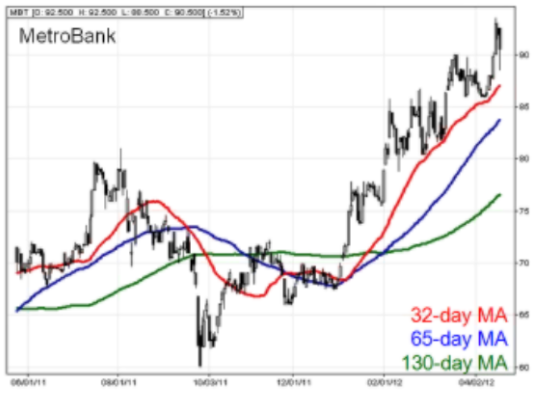
Moving Averages A price-average line plotted onto a chart in direct reference to market price. It can be used to:
Use:
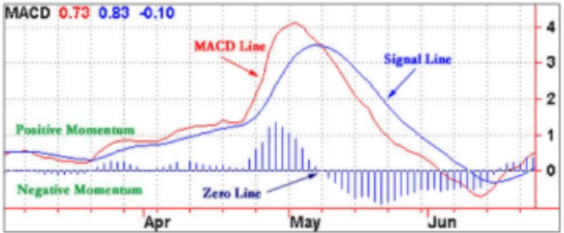
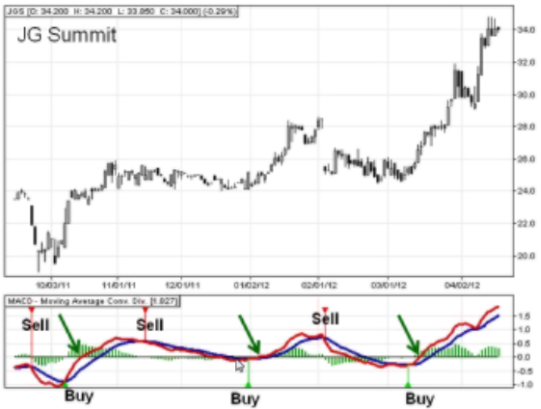
MACD (Moving Average Convergence Divergence) A lagging but effective momentum tool that uses a crossover system to justify changes in periodic trends. It has three component lines:
Use: A Buy signal is followed when:
A Sell or take profits when MACD crosses below the Signal Line. RSI (Relative Strength Index) A momentum-oscillator that swings from Overbought and Oversold conditions to highlight extreme ends of a price move. It can also spot out Bullish or Bearish Divergence. A Divergence is a lapse in strength shown in the RSI compared with its Price. i.e in an uptrend, a higher-high in price compared with a lower-high in RSI shows a lapse in bullish force. Putting All Together Work On Your Own Trade Routine Creating a Trading Plan Practice the discipline technically evaluating your prospect - know your upsides and downsides and plan your action ahead of the trade.
A Justified Entry: Trade Filtering Estimate Your Targets Looking for Price Targets Evaluate what your upsides can be by following these technical methods:
Establish Your Selling Stops Triggered Exits using Support Stops:
Establish Your Risk Vs. Reward Evaluate your prospects A key component in being a successful trader is to determine your risk versus reward level and use that optimum ratio to guide your investment decisions.
Knowledge born from actual experience
0 Comments
Leave a Reply. |
PLACE YOUR ADS HERE YOUR PAYDAY REMINDER FEATURED PARTNER FEATURED PROMOTIONS FEATURED MENTIONS PLACE YOUR ADS HERE PLACE YOUR ADS HERE For more updates about Personal Development, Financial and Investment Education. Join and Subscribe to my Newsletter. It's FREE! ABOUT THE BLOGGERHi, I'm Ralph Gregore Masalihit! An RFP Graduate (Registered Financial Planner Institute - Philippines). A Personal Finance Advocate. An I.T. by Profession. An Investor. Business Minded. An Introvert. A Photography Enthusiast. A Travel and Personal Finance Blogger (Lakbay Diwa and Kuripot Pinoy). Currently, I'm working my way toward time and financial freedom. PLACE YOUR ADS HERE Follow me on |


