Personal Development, Business, Finance, and Investing for Everyone
An investment in knowledge always pays the best interest.
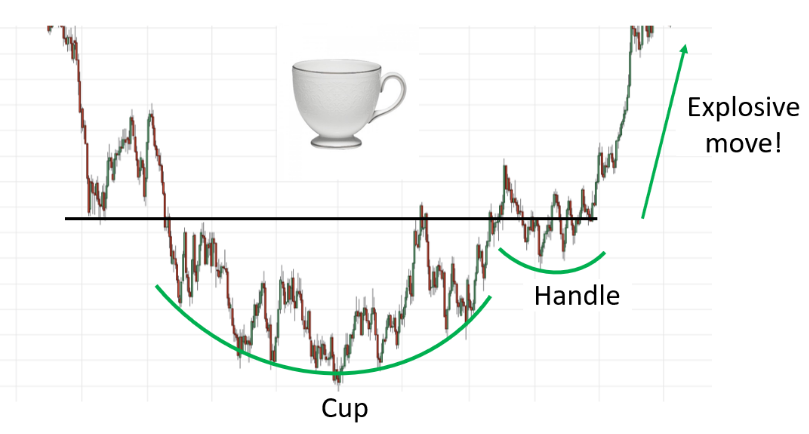
Cup And Handle Chart Pattern: What Investors And Traders Should Know About This Technical Indicator9/18/2022 If you have been in the stock market for some time, you may have heard of an indicator called the Cup and Handle Chart Pattern. A strong accumulation price pattern which leads to an explosive breakout. 𝗪𝗵𝗮𝘁 𝗶𝘀 𝗮 𝗖𝘂𝗽 𝗮𝗻𝗱 𝗛𝗮𝗻𝗱𝗹𝗲 𝗽𝗮𝘁𝘁𝗲𝗿𝗻? The Cup and Handle is a bullish continuation pattern that resembles a cup with a handle. It is visualized as the alphabet u and looks like a rounding bottom pattern. The handle formed as a range or a smaller u. The cup marks a consolidation phase, whereas the handle has a slight downward move, which marks a retest phase. However, the handle is meant to signal a buying opportunity. When this part of the price formation is over, the stock may reverse the course and resume the prior uptrend. There are three components of a Cup and Handle Chart Pattern—what are they? • Cup • Handle • Neckline 𝗣𝗿𝗶𝗼𝗿 𝗧𝗿𝗲𝗻d
The cup and handle pattern is a bullish continuation pattern, hence the prior trend should be an uptrend. 𝗖𝘂𝗽 L𝗲𝗻𝗴𝘁𝗵 In general, the cups with longer and more U shaped bottoms that resemble a rounding bottom, provide a stronger signal. This ensures that the cup is a consolidation pattern with valid support at the bottom of the U. The perfect pattern would have equal highs on both sides of the cup, but this is not always the case. In general, cups with sharp V bottoms should be avoided because there is almost no consolidation in this case. 𝗖𝘂𝗽 D𝗲𝗽𝘁𝗵 Normally, the cup should not be overly deep. In the example image above, the cup depth can be up to 60-70% of the last swing move. (This can vary widely, though.) 𝗛𝗮𝗻𝗱𝗹𝗲 The handle can occur in the form of a flag, a pennant, or a rectangular consolidation. This is the final retracement phase before the impulsive move higher. By and large, the handle can retrace anywhere between 40-60% of the depth of the cup. 𝗕𝗿𝗲𝗮𝗸𝗼𝘂𝘁 Bullish confirmation comes when the pattern breaks above the neckline (made using the prior highs) with a good volume. 𝗩𝗼𝗹𝘂𝗺𝗲 In general, the volumes should decrease during the formation of the base of the cup and during the formation of the handle. Conversely, the volumes should pick up when the stock begins to make its move higher, back up to test the previous high. 𝗧𝗮𝗿𝗴𝗲𝘁 Using the measurement objective, the target comes out to be equal to the depth of the cup. It can be measured by calculating the distance between the bottom of the base and the neckline. 𝗦𝘁𝗼𝗽-𝗹𝗼𝘀𝘀 Ideally, the stop loss is placed at the lowest point of the handle. But if the price oscillated up and down a number of times within the handle, the stop-loss can also be placed below the most recent swing low.
0 Comments
Leave a Reply. |
PLACE YOUR ADS HERE YOUR PAYDAY REMINDER FEATURED PARTNER FEATURED PROMOTIONS FEATURED MENTIONS PLACE YOUR ADS HERE PLACE YOUR ADS HERE For more updates about Personal Development, Financial and Investment Education. Join and Subscribe to my Newsletter. It's FREE! ABOUT THE BLOGGERHi, I'm Ralph Gregore Masalihit! An RFP Graduate (Registered Financial Planner Institute - Philippines). A Personal Finance Advocate. An I.T. by Profession. An Investor. Business Minded. An Introvert. A Photography Enthusiast. A Travel and Personal Finance Blogger (Lakbay Diwa and Kuripot Pinoy). Currently, I'm working my way toward time and financial freedom. PLACE YOUR ADS HERE Follow me on |


